Facts and figures

Total factoring volume

Total factoring volume in EU by country in the last 9 years (in Millions of EUR)

Country200720082009201020112012 GDP penetration 2012Market share 2012
Austria* 5219 6350 6631 8307 8986 10969  3.54% 0.91%
Belgium* 19200 22500 23921 32200 36871 42352  11.17% 3.51%
Bulgaria 300 450 340 475 1010 1500  3.79% 0.12%
Cyprus 2985 3255 3350 3450 3758 3250  18.20% 0.27%
Czech Republic* 4780 5000 3773 4498 5132 5196  3.41% 0.43%
Denmark* 8474 7500 7062 8179 9158 8800  3.62% 0.73%
Estonia 1300 1427 1000 1220 1164 1877  11.10% 0.16%
Finland 12650 12650 10752 12400 13000 17000  8.74% 1.41%
France* 121600 135000 128182 153252 174580 186494  9.19% 15.45%
Germany* 89000 106000 96210 132280 157260 157424 5.95 13.04
Greece* 7420 10200 11900 14716 14732 12761 6.59 1.06
Hungary 3100 3200 2600 3254 2817 2676 2.71 0.22
Ireland* 22919 23618 19140 20197 18330 19956 12.25 1.65
Italy* 122800 128200 124250 143745 175182 181878 11.62 15.06
Latvia 1160 1520 977 328 371 542 2.45 0.04
Lithuania 2690 3350 1755 1540 2134 2488 7.59 0.21
Luxembourg 490 600 349 321 180 299 0.68 0.02
Malta 25 52 50 136 200 240 3.53 0.02
Netherlands* 31820 30000 30000 35500 46000 51187 8.52 4.24
Poland* 7900 11486 11997 16210 17900 24510 6.45 2.03
Portugal* 16888 23460 23564 24488 27879 22948 13.87 1.90
Romania 1300 1650 1200 1800 2600 2920  2.22  0.24 
Slovakia 1380 1600 1122 981 1171 1024  1.42  0.08 
Slovenia 455 650 600 650 550 650  1.83  0.05 
Spain* 83699 100000 104222 112909 122125 124036  11.83  10.27 
Sweden* 21700 16000 18760 30516 29259 33149  8.09  2.75 
United Kingdom* 286496 189650 193809 226401 268100 291200  15.34  24.12 
Total EU 877810 843379 827516 989951 1140448  1207325 9.36  100.00%
*Total EUF members 811327 773515 761097 963396 1111493  1172859 9.63  97.15 
  • Created on .

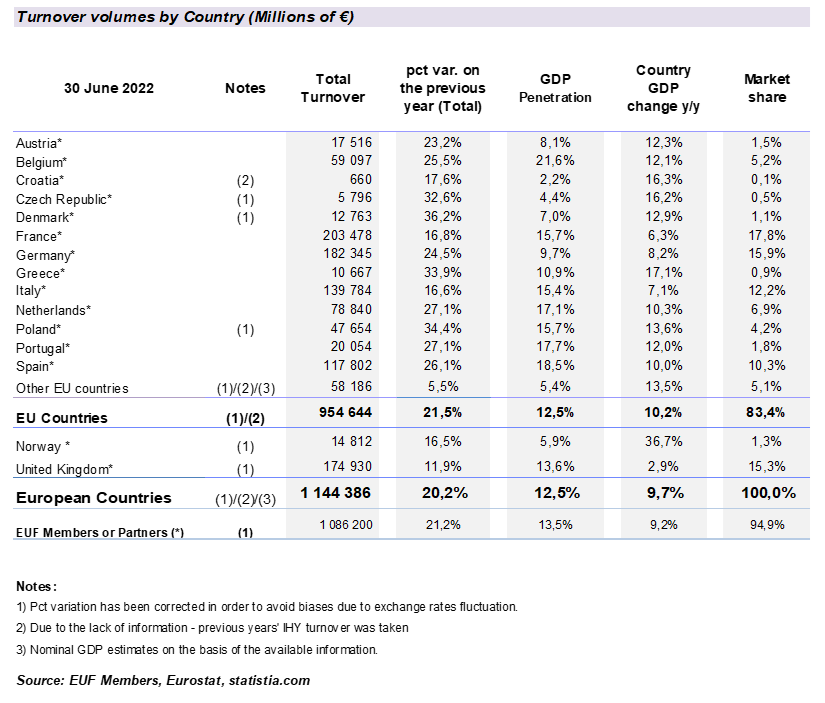
Factoring turnover in Europe

The total turnover for the factoring and commercial finance industry across the Europe in 2021 was 2 Trillion Euros. EUF Members represented 94% of the turnover in the Europe with the top five countries making up nearly 73% of the total market. The factoring industry turnover represented 11.4% of Europe GDP in 2021.

Total Factoring Volume in Europe in 2021

All volumes are shown in Euros. NB The year on year growth for non Euro countries may be affected by changes in exchange rates.


Source: EU National Associations and FCI statistics.

View the data as plain text

  • Created on .